
In general, we usually hope or want everything in our lives to go right. (Actually, who doesn’t want?) Unfortunately, most of the time, everything doesn’t turn out the way we hoped, planned or expected. Sometimes things don’t go well.

In fact, as a developer, our expectations are, as in our lives, that everything in our applications goes well. We want both the functional features of the applications that we have developed to be able to work smoothly (without any bugs) and to be able to work how customers requested. We also want that our applications have good non-functional features. For example performance criterion.
Most of the time the performance criterion is an important thing to be able to keep customers in our system. Imagine, we will shop from an e-commerce website and something’s not going well. Products are not added to the basket and also response times are too high. If we look at from the end user’s perspective, these situations are annoying, aren’t they?

Our application could be great, but the impact of the performance criterion will be reflected in the application in a bad way.
As a developer, a big responsibility falls over us. If we want to develop a high-performant application or improve/refactor that, we should know which part of our application has a bottleneck so we can focus on that point.
Anyway, I want to say “software development” is not just about “programming”. It’s more than programming. An application that we develop, may not always run as excepted. Performance problems may occur at unexpected times or the human factor may cause bugs. I guess the real point here is how we can survive and overcome these inevitable realities.
By the way, there are different topics where “unexpected times” could work.

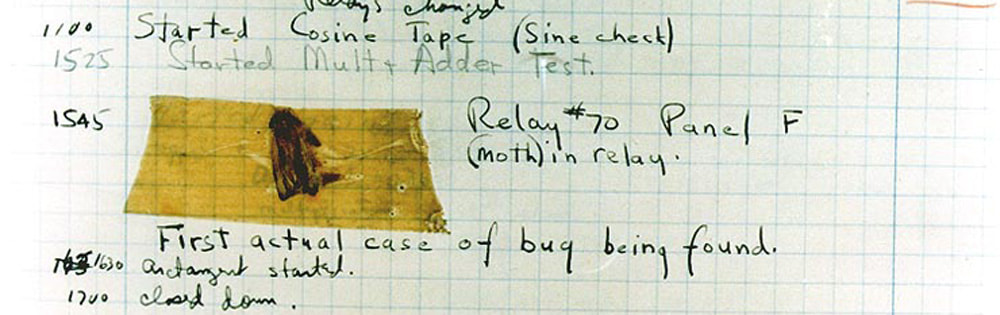
Well, actually the point that I want to link is, “bug” and “debugging” operations that Grace Hopper pioneered in her terms.
Especially, I guess, the actual challenge starts for us when the topic is about the performing “debugging” and “profiling” operations on runtime.
In this article which will be the first of a two articles series, we will try to take a look on “how we can perform debugging and profiling operations for .NET Core applications on linux” topic with a few sample use-cases, that I have already presented at the “dotnet reconnect()” event as a speaker.
During the debugging and profiling operations, we will use some tools such as “Perf“, “LTTng“, “gcore“, “FlameGraph” and “LLDB“. In this 1st article serie, we will make an introduction to the concepts of “sample” and “tracing”. Then we will perform a profiling operation with “Perf” tool after that a tracing operation with “LTTng” tool.
NOTE: During the article, I will assume that you are familiar with such things in the windows environment.
Sampling & Tracing
Before starting to debugging & profiling operations, I want to remind two different concepts. When we need to measure the CPU, we have two measurement modes. One of these is sampling, the other is tracing.
Sampling
When sampling mode is selected, profiler queries the call stacks of the running threads to find the slowest part of the code periodically. I mean, it takes snapshots in certain windows.
Sampling mode is usually a good option for long-running methods or if you take a look performance bottlenecks for the first time. Sampling mode doesn’t add any overhead to the application and also it is possible to get CPU times. The only disadvantage of the sampling mode is that it doesn’t capture all call stacks because it takes snapshots in certain windows.
Tracing
When tracing mode is preferred instead of sampling, profiler watches each method invocations to be able to capture the thread CPU time that spent in the method (entry & exit).
Tracing mode offers us more detailed information, unlike sampling mode. In addition to CPU times, method invocation counts can be obtained. Of course, we know there is some overhead here with the tracing mode.
Usually, we may prefer the tracing mode in certain scenarios or if the sampling mode results are not enough to resolve bottlenecks.
Profiling CPU Activities with Perf
Perf is an event-oriented profiler tool that helps us for performance investigations on linux-based systems.

Perf is capable of both sampling and tracing topics for a lot of different events (e.g: kernel events, hardware events etc…). Also, perf is based on the “perf_events” interface of the linux kernel and there are a lot of event sources that we can attach to “perf_events“.
For example:
- Hardware Events
- Software Events
- User Statically-Defined Tracing
- Dynamic Tracing
- etc…
A simple Profiling with Perf
Before we start the profiling operation, we need a bad application to perform an example. If you want, you can also use your existing application. As a result, our goal is to monitor CPU activities of our applications.
I will create a console application that can do a lot of CPU consuming in order to perform a profiling sample. This console application will find the prime number in the corresponding index of a given array and then calculate its square root (I may a little have exaggerated, let’s not focus on the example).
The sample application I have created like below.
“PrimeNumberFinderHelper.cs” file:
using System;

namespace PrimeNumberFinder
{
    public class PrimeNumberFinderHelper
    {
        public long FindNthPrimeNumber(int number)
        {
            int count = 0;
            long a = 2;

            while (count < number)
            {
                long b = 2;
                int prime = 1;
                while (b * b <= a) { if (a % b == 0) { prime = 0; break; } b++; } if (prime > 0)
                {
                    count++;
                }
                a++;
            }
            return (--a);
        }
    }
}
and “Program.cs” file:
using System;
using System.Linq;
using System.Threading;

namespace PrimeNumberFinder
{
    class Program
    {
        static PrimeNumberFinderHelper _primeNumberFinderHelper;

        static void Main(string[] args)
        {
            int[] numbers = GetNumbersFromArgs(args);

            for (int number = 0; number < numbers.Length; number++) { Console.WriteLine("Finding {0}nth prime number...", numbers[number]); _primeNumberFinderHelper = new PrimeNumberFinderHelper(); long nthPrimeNumber = FindNthPrimeNumber(numbers[number]); Console.WriteLine("{0}nth prime number is {1}.", numbers[number], nthPrimeNumber); double squareRootOfNthPrimeNumber = FindSquareRootOfNthPrimeNumber(nthPrimeNumber); Console.WriteLine("Square root of {0}nth prime number is {1}.", numbers[number], squareRootOfNthPrimeNumber); } Console.WriteLine("Done!"); } private static int[] GetNumbersFromArgs(string[] args) { return args.Select(x =>
            {
                (bool, int) input = CheckIsItANumber(x);

                if (input.Item1)
                {
                    return input.Item2;
                }

                return default(int);
            }).ToArray();
        }

        //Some child methods for profiling callchain.
        static double FindSquareRootOfNthPrimeNumber(double nthPrimeNumber)
        {
            double squareRoot = 0;

            squareRoot = Math.Sqrt(nthPrimeNumber);

            Thread.Sleep(10000);

            return squareRoot;
        }

        //Some child methods for profiling callchain.
        static long FindNthPrimeNumber(int number)
        {
            //CPU intensive sample for profiling with perf on linux.
            long nthPrimeNumber = _primeNumberFinderHelper.FindNthPrimeNumber(number);

            return nthPrimeNumber;
        }

        //Some child methods for profiling callchain.
        static (bool, int) CheckIsItANumber(string num)
        {
            int? result = null;

            try
            {
                result = int.Parse(num);
            }
            catch (System.Exception ex)
            {
                Console.WriteLine("Exception occured while parsing.");
            }

            return (result != null, result.GetValueOrDefault()); // It can be cause wrong business logic.
        }
    }
}
Here is the sample console application that will run CPU intensive.
There are a few points we should know before we start to profiling operation with perf. Perf needs to have symbol files like other debugging tools in order to show meaningfully result sets. Just like “pdb” files.
Thus, memory addresses, which we will get as a result of the profiling operation, will be converted as “method name” and “variable name” meaningfully. Otherwise, we will see just hexadecimal values in compiled languages like C#.
We need to enable an environment variable in order to provide symbol information. By enabling the “COMPlus_PerfMapEnabled” variable, we are telling the CLR that it should provide debug information for usage of perf.
Now let’s enable the environment variable and then run the console application.
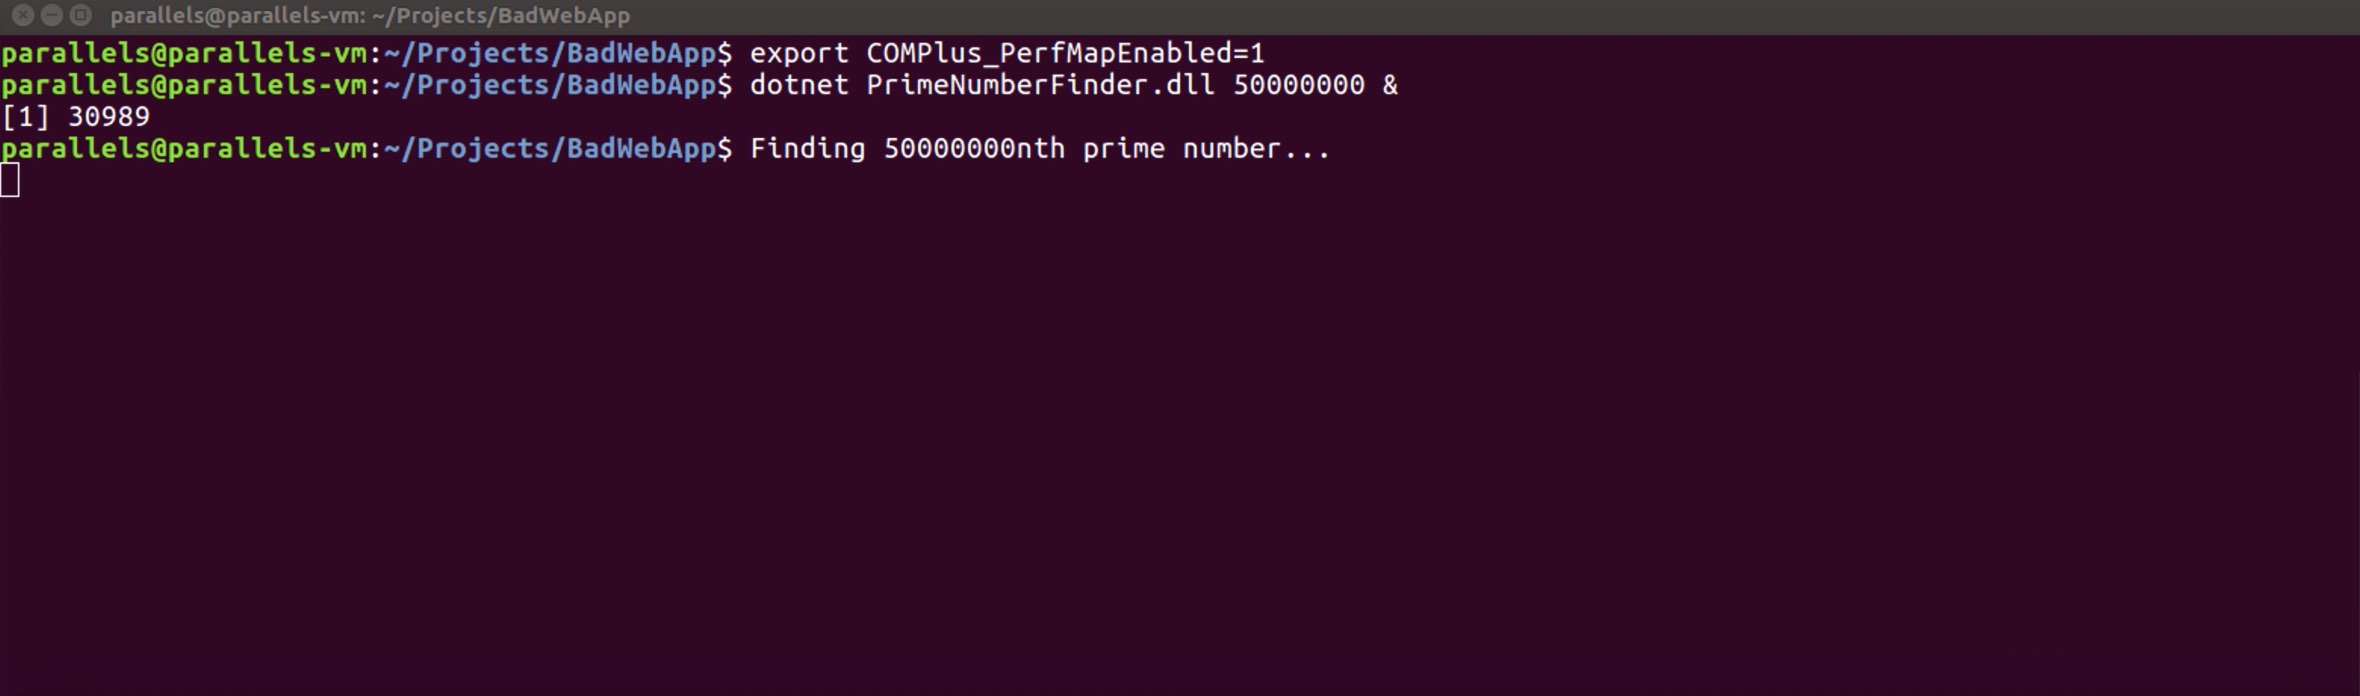
We enabled the environment variable and told it to find a prime number that would enforce the application greatly.
So, how is the system now?
Let’s run the “top” command and look at the processes.
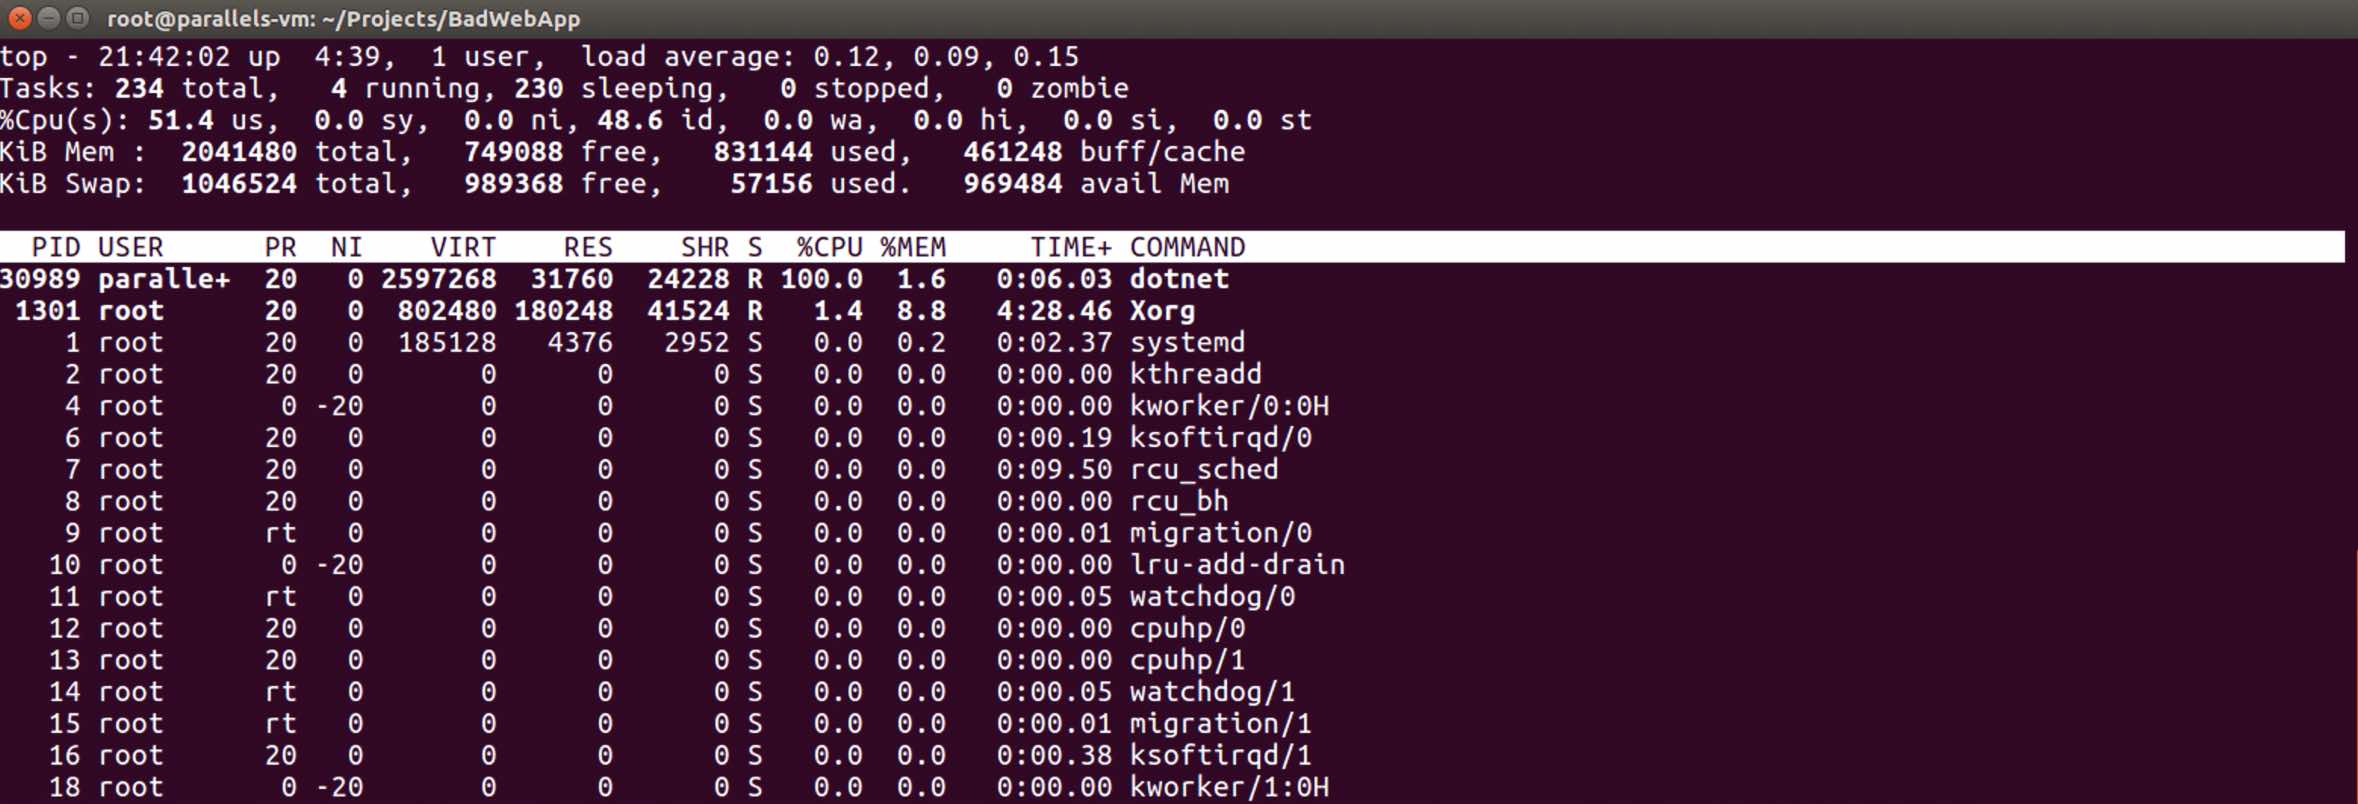
Did you see? This “30989” process is using 100% of the CPU!

Let’s profile this process. We need to know where is the bottleneck in the application and which code paths we should focus on.
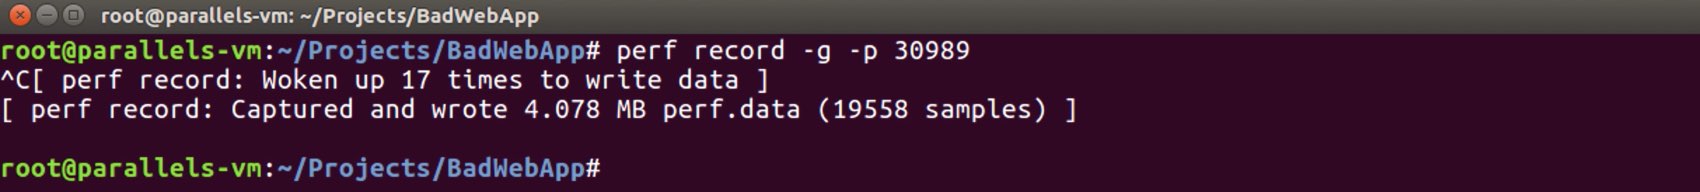
Well in the simplest way, we can start profiling operation for the process, which is id “30989“, with the following command.
perf record -g -p 30989
- record: we are specifying with this command that we will collect the performance counter profile data.
- -g: by using this parameter, we are specifying that we will get the call graph data. Perf collects time info as default.
- -p: we are specifying the process id which we want to profile.
NOTE: There are different parameters that we can use. You can reach another parameters from here.
In a few seconds let’s stop the sampling operation. If we look at the result, perf collected total “19558” samples in “4.078” MB size within a few seconds. Perf also wrote this results in a file called “perf.data”.
NOTE: If an event that you want to listen is invoking frequently, the size of the “perf.data” file will be quite large. Instead of this, real-time profiling using “Memory Mapped Buffer” is also possible.
If you want you can perform the “perf.data” analysis operation on the same machine or on a different machine.
So, how do we able to read this profiling result? In the simplest way, by running the following command line.
perf report -f
NOTE: In order to not face any regular or root user problem when reading the profiling result, we can skip that ownership validation with the “-f” parameter.
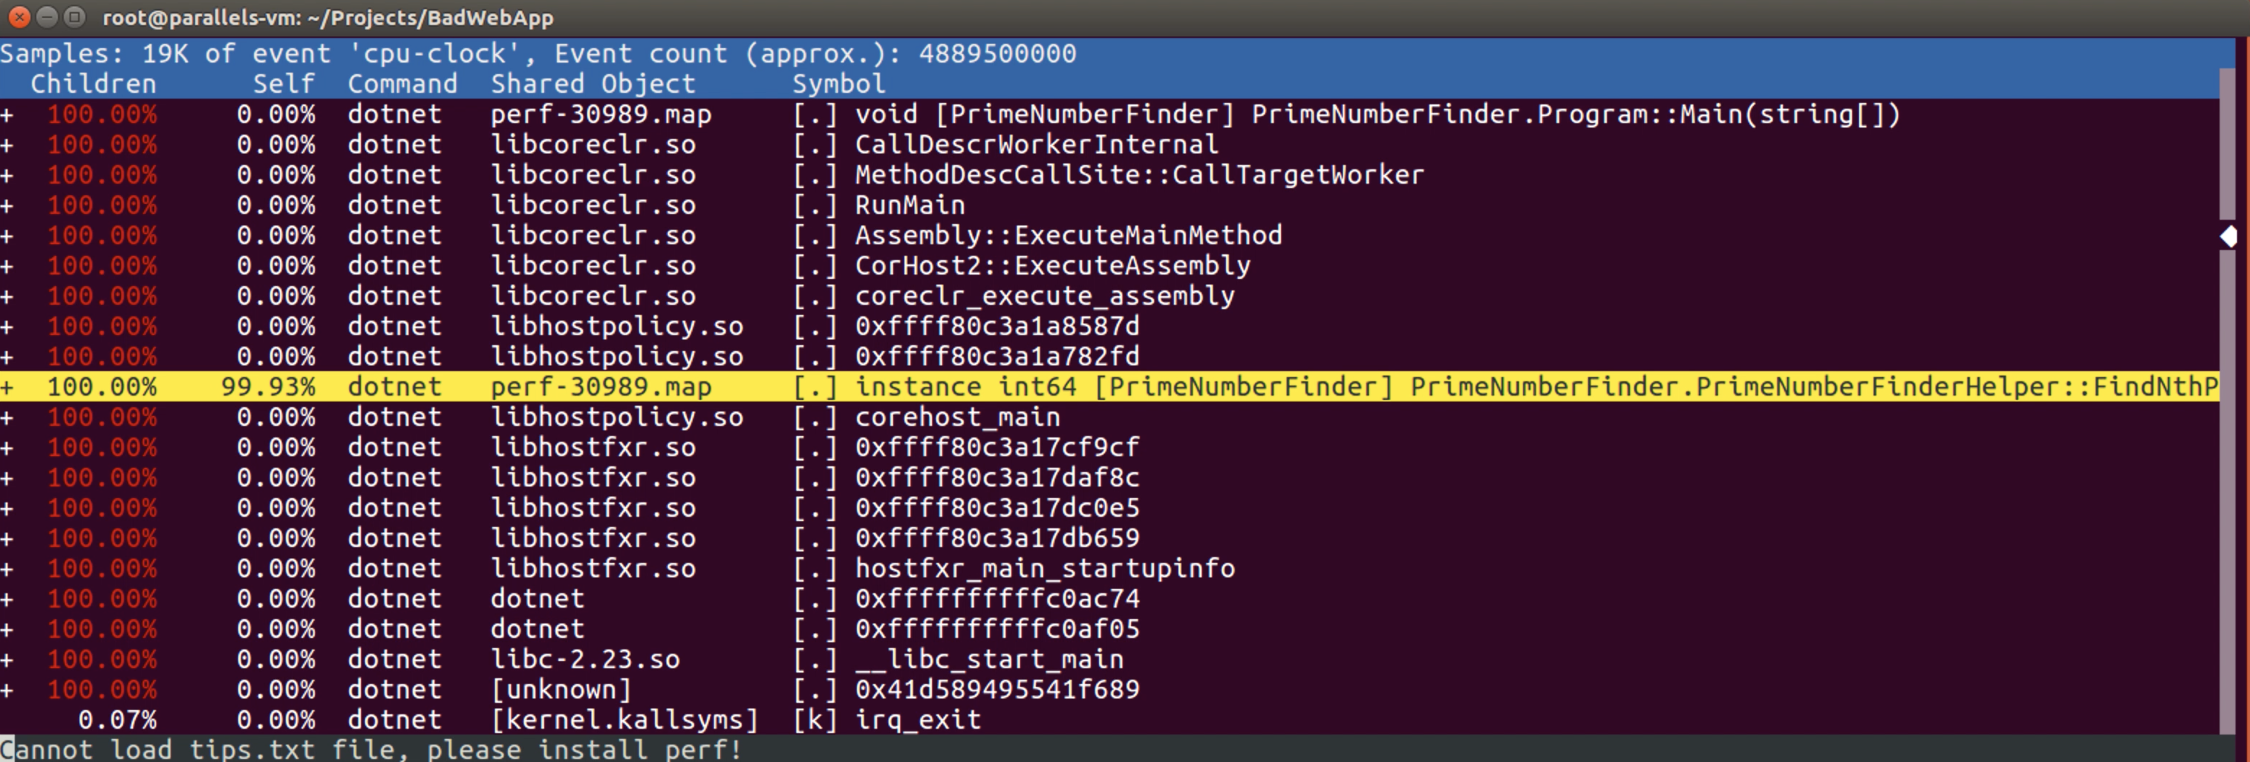
Now we are seeing the profiling result of the process “30989“. In the above result, it’s possible to see the CPU activities on the call stacks of the process. If we look at the “Symbol” column, we can see the parts, which we want to know, turned into method names and variable names.
The “Children” column shows us the overheads of subsequent calls. If we look at the first row, we can see the “Children” part is 100%, but the “Self” part is 0%. So the “Children” part tells us “I’m going on a costly path, but the costly path is not here yet”. The “Self” part is where the costly path is.
Now if we look at the highlighted row, we can see the “Self” part is 99.93%. For this process, we can say the point, which is causing highly CPU consuming, takes a part in the “FindNthPrimeNumber” method of the “PrimeNumberFinderHelper” class.
So, where is the using of the “PrimeNumberFinderHelper” instance? Let’s gather a little more detail and look at the calls! To do that, we can just press the enter key on the highlighted row.
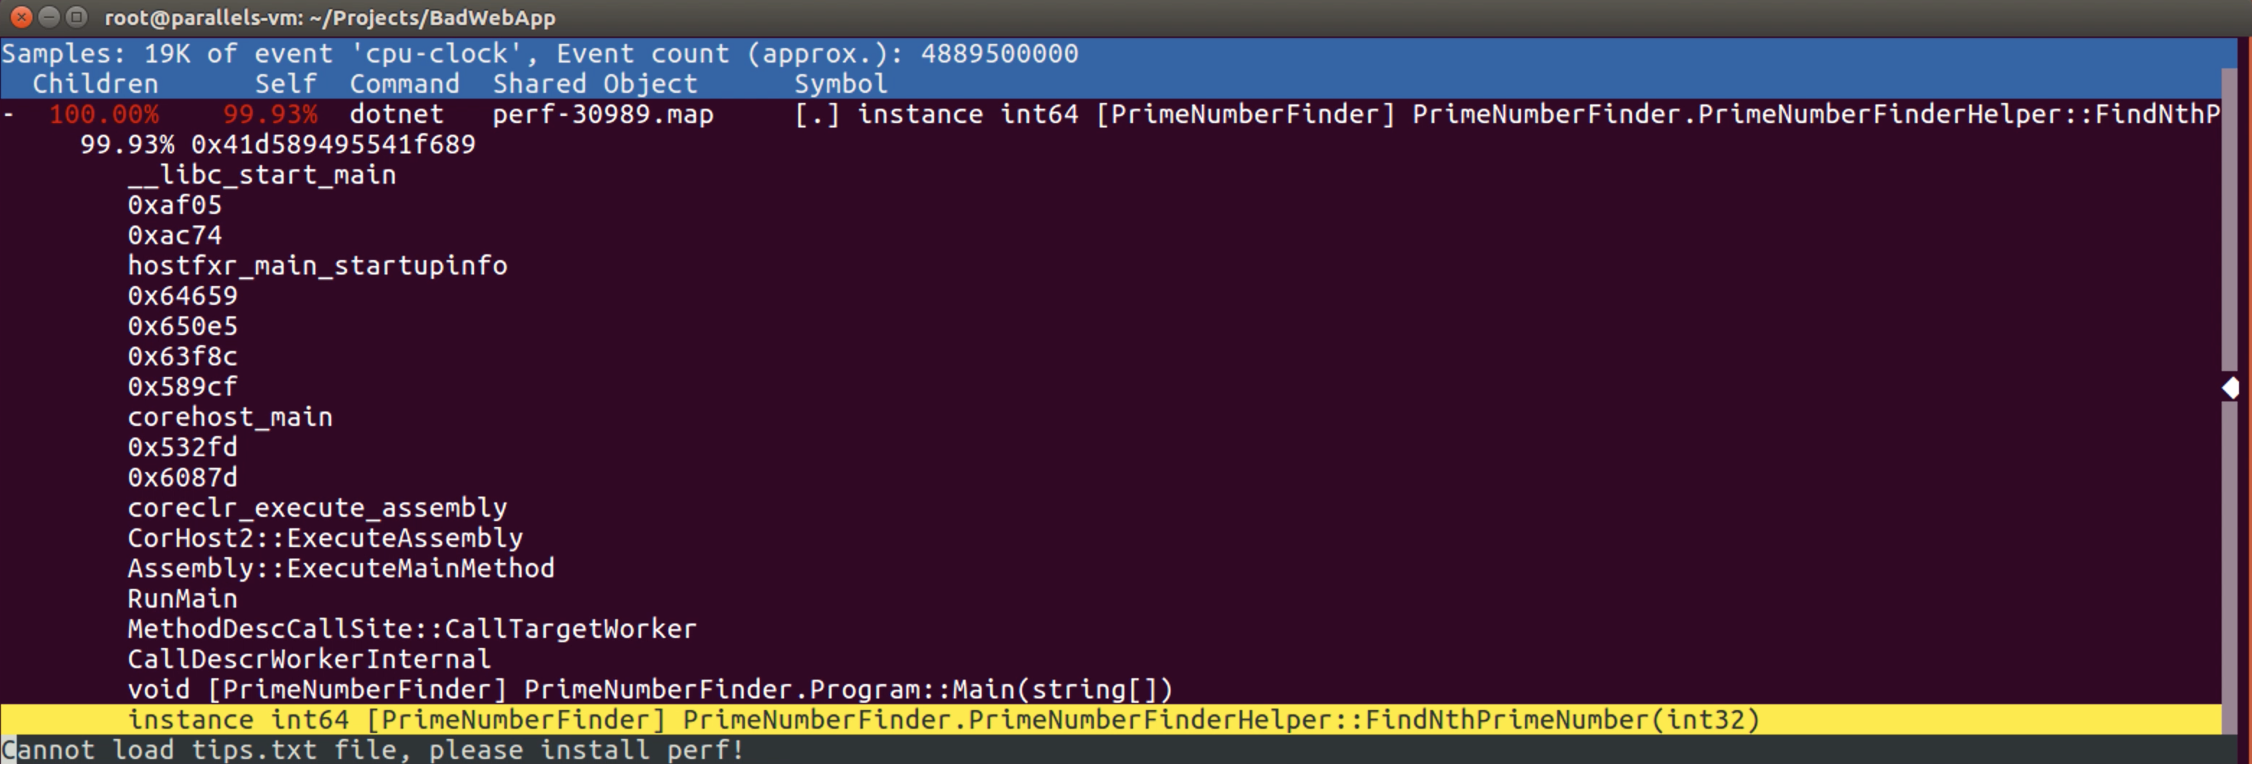
If we look at the bottom part of the tree, we can see the “FindNthPrimeNumber” method was called through the instance of the “PrimeNumberFinderHelper” class after the code flow passes from the “PrimeNumberFinder.Program::Main” method.
NOTE: There are lots of parameters to use with the “report” command of perf. For example you can increase the level of verbose, hide some results that symbol info is not resolved or display the call graph based on the different parameters. You can access the details from here.
In the simplest way, we have determined the problematic point by performing a sampling operation on the process. Now we know where we need to focus on as a developer.

2 – Tracing Runtime Events with LTTng
![]()
We will use LTTng tool in order to trace runtime events. LTTng handles user-space events (I mean runtime services, application-level events) using tracepoints that generated by CoreCLR in build-time.

LTTng is a lightweight tracing framework that allows us to handle more in-depth problems like ETW (Event Tracing for Windows) events.
Unfortunately, ETW events are not available on linux. In a similar way to ETW events, we are able to perform tracing operations on linux with the lttng framework.
It’s possible to trace the following events with lttng:
- Garbage collections
- Assembly load/unload
- Thread start/stop
- Object allocations
- Exception thrown
Also if we want, we can analyze the results on the same machine or another machine just like perf.
Well, let’s go into some practice!
In order to do some example with lttng, let’s assume we have an API and it needs to use its memory efficiently.
There is an environment variable that we should enable before starting to tracing operation with lttng. By enabling the “COMPlus_EnableEventLog” value, we are telling the CoreCLR to generate event logs in order to use for tracing.
The source code of the sample API is available here. It is similar to the example we have done with perf. We will look at the object allocations in this API while sending requests that includes a series of numbers to the “api/calculate” endpoint.
The command lines that we will use are as follows:
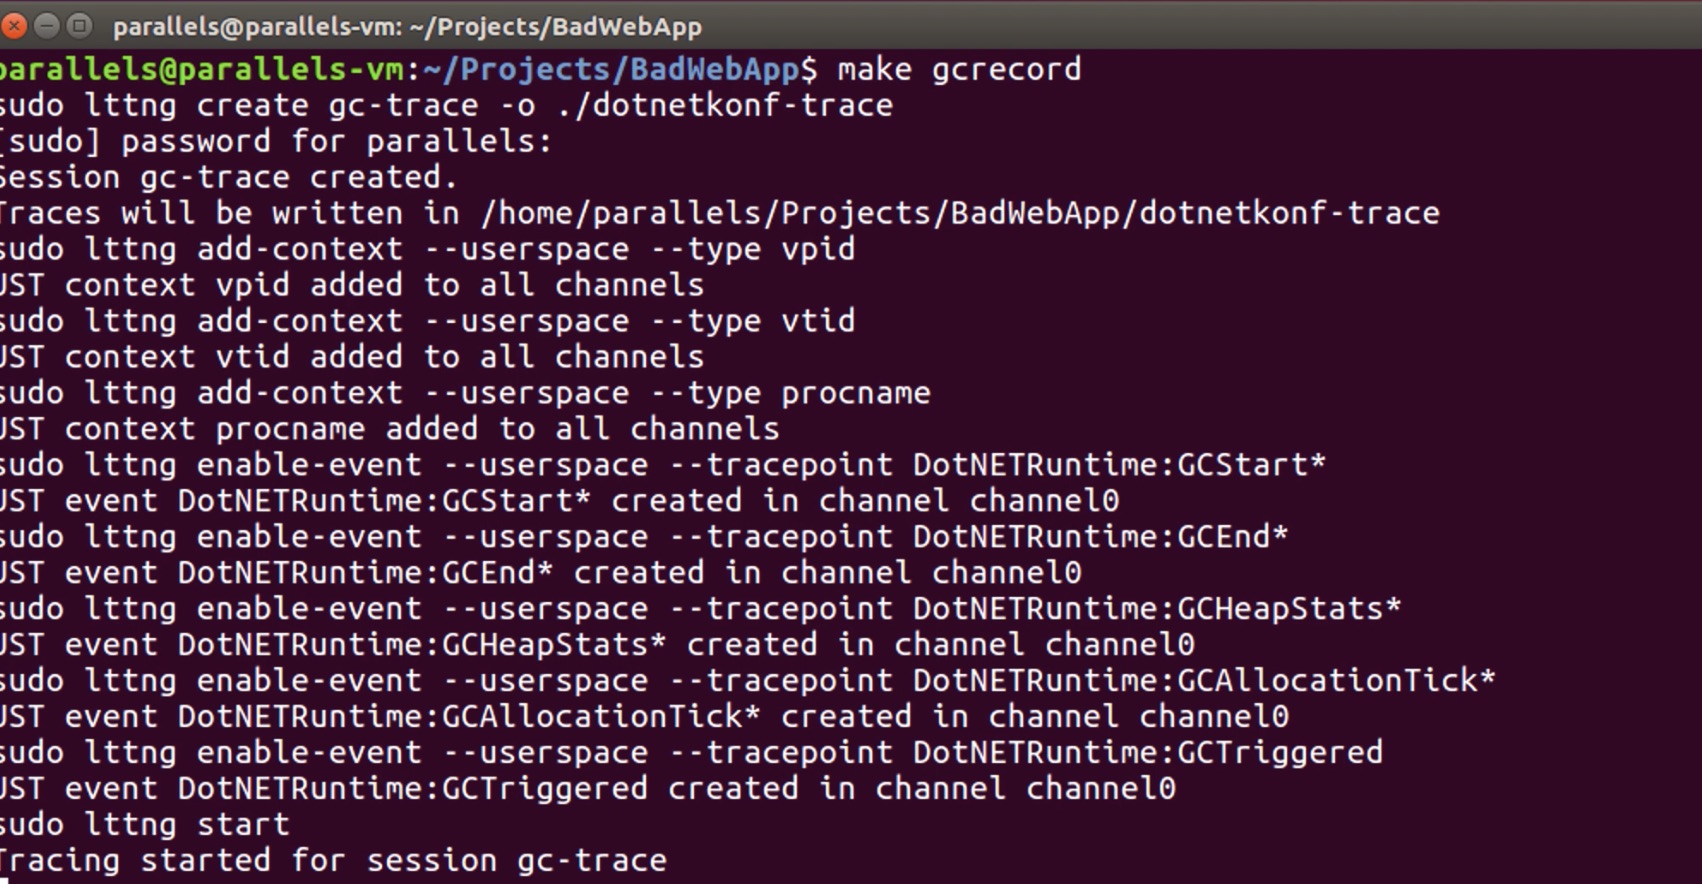
sudo lttng create gc-trace -o ./dotnetkonf-trace
sudo lttng add-context --userspace --type vpid
sudo lttng add-context --userspace --type vtid
sudo lttng add-context --userspace --type procname
sudo lttng enable-event --userspace --tracepoint DotNETRuntime:GCStart*
sudo lttng enable-event --userspace --tracepoint DotNETRuntime:GCEnd*
sudo lttng enable-event --userspace --tracepoint DotNETRuntime:GCHeapStats*
sudo lttng enable-event --userspace --tracepoint DotNETRuntime:GCAllocationTick*
sudo lttng enable-event --userspace --tracepoint DotNETRuntime:GCTriggered
sudo lttng start
sleep 20
sudo lttng stop
sudo lttng destroy
In the first command line, we said to the lttng that it should collect results into the “dotnetkonf-trace” path and create a session called “gc-trace“. In the next line, with the “lttng add-context” parameter, we specified that each event should have some information such as “process id“, “thread id“, and “process name“.
With the “lttng enable-event” parameter we defined tracepoints which we want to trace. Thus, we can trace some important events which will be generated by CoreCLR such as “DotNETRuntime:GCStart*” and “GCAllocationTick*“. After the start of the tracing operation, we destroy the session “20” seconds later (tracing operation requires some time unlike sampling).
NOTE: Of course it will be difficult to write these commands one by one. Therefore, if you want you can reach the makefile that I use from here.
Before starting to tracing operation, first, let’s run the sample API and sent a few requests to the “api/calculate?nums=100,200,300,400,500” URL. I will use Apache Bench for sending request.
ab -n 10000 localhost:5000/api/calculate?nums=100,200,300,400,500
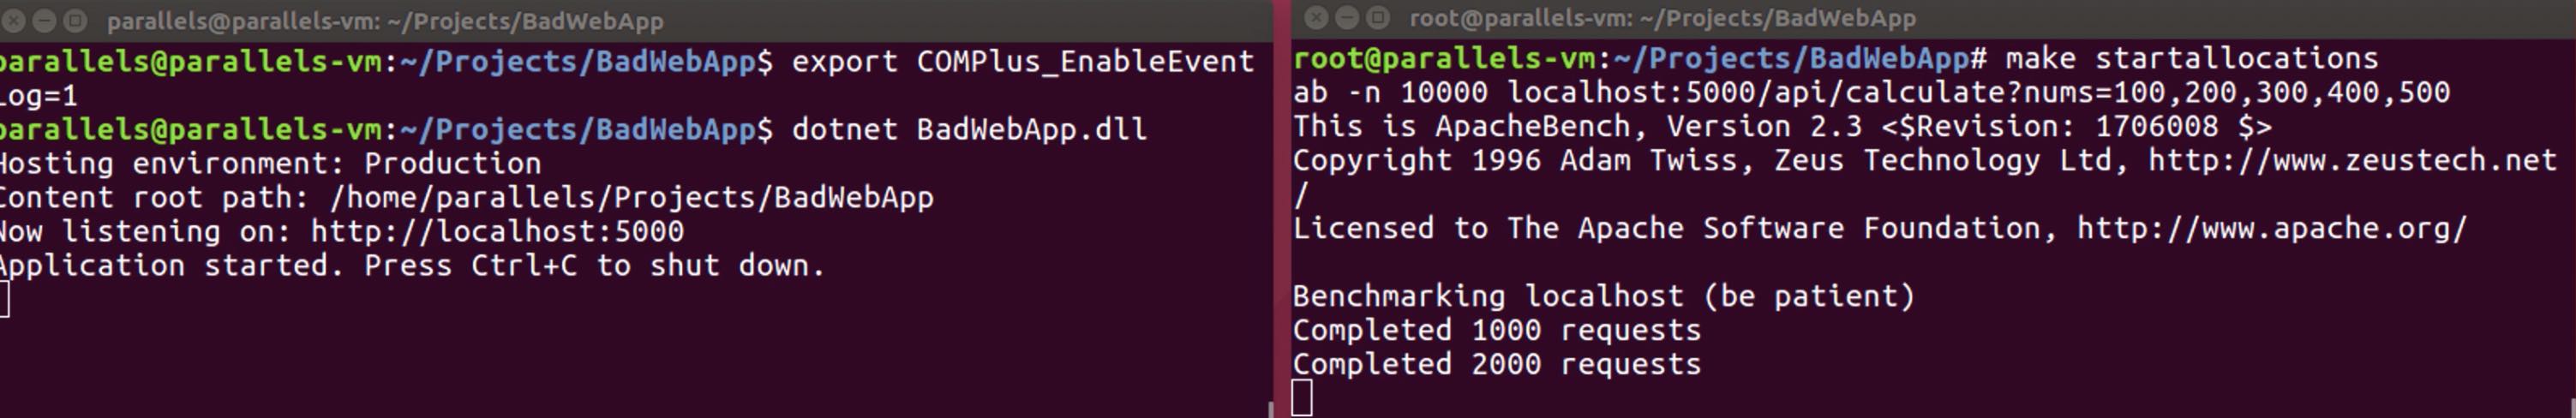
Let’s start the tracing operation while sending the requests to the API.
It will stop after waiting for 20 seconds.
Well, how we can read the tracing results collected into the “dotnetkonf-trace” path. As a first option, we can use the babeltrace.
If you want, you can also use the Eclipse Trace Compass which is more user-friendly. Since the tracing results are in the CTF(Common Trace Format) format, it is also possible to display them visually.
Anyway, let’s look at the results with the following command.

sudo babeltrace ./dotnetkonf-trace | grep GCAllocationTick* | grep 'TypeName = "[^"]*"' -o | sort | uniq -c | sort -n
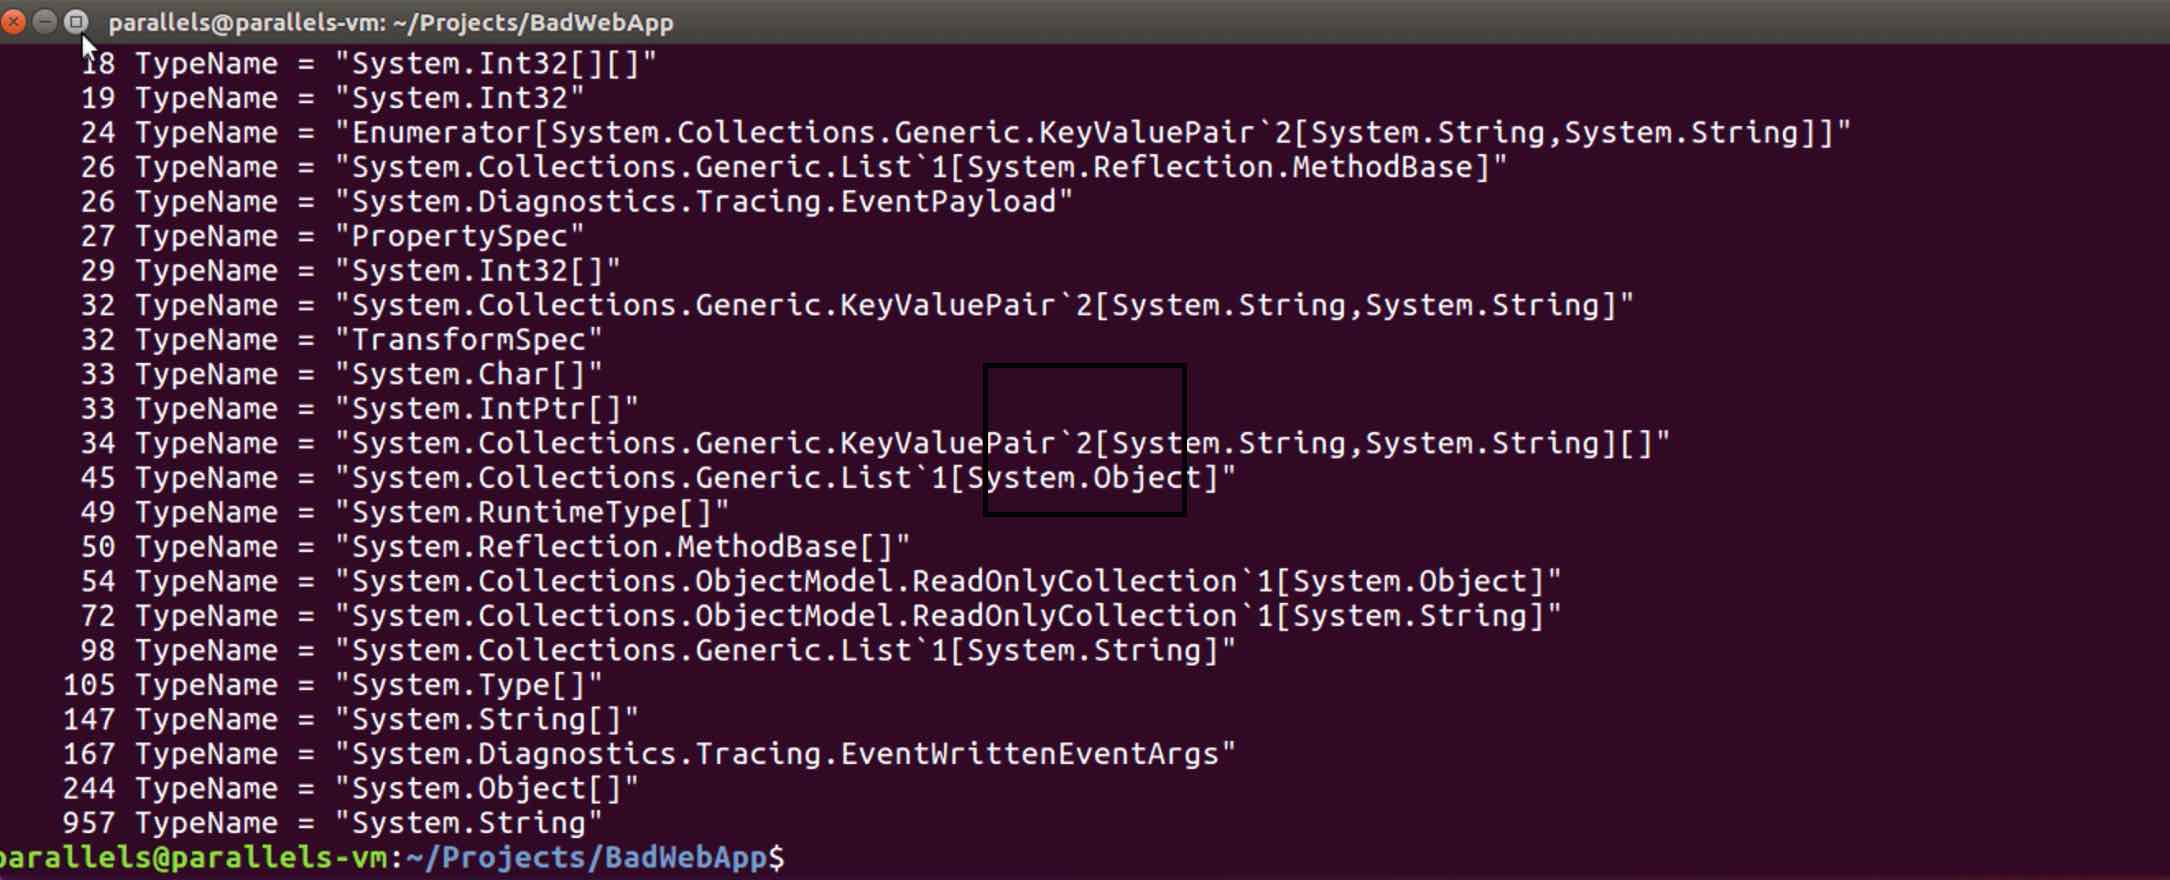
and the results!
As you can see, 957 “System.String” and 244 “System.Object[]” objects have been allocated in the API within 20 seconds. By the way, the point we need to know here is, these allocation results are not the results of each allocation. The allocation results are the results of approximately every 100KB of object allocations.
So, where do these object allocations come from? If you think where is the call stack information of these object allocations, you are on the right way. Unfortunately, lttng do not have any stack trace support for user-space yet (I guess they are planning in 2.11 release. LTTng milestone).
There are a few ways to reach stack trace information. Sasha Goldshtein has a great article on this topic. In my next article, I will also write about the reaching stack trace information and how we can analyze core dumps.

Some References
https://www.embedded.com/design/operating-systems/4401769/Device-drivers-in-user-space
http://www.brendangregg.com/perf.html
https://lttng.org/docs/v2.10/
http://blogs.microsoft.co.il/sasha/2017/03/30/tracing-runtime-events-in-net-core-on-linux/
https://lttng.org/blog/2018/08/28/bringing-dotnet-perf-analysis-to-linux/
Be First to Comment