As we know, the best way to debug our applications that crash or hang due to memory leaks or unknown reasons is to analyze the dump files. At least that’s how my experience has been so far. As developers, at least we need to be able to analyze dumps to roughly understand why our applications are behaving unexpectedly. I have written different articles and made presentations on similar topics before.
- dotnetKonf Event – Debugging and Profiling .NET Core Applications on Linux
- Overview of Debugging & Profiling .NET Core Applications on Linux – 1 (Perf, LTTNg)
- WinDBG ile Dump Analizi Yaparak Performans Sorunlarını Çözümleme
Within the scope of this article, I will try to show how we can get dumps of our applications from both windows-based and linux-based containers running on a kubernetes environment and how we can analyze them on windows in the simplest way.
Scenario
Let’s assume that an application we deployed on Azure Kubernetes Service crashes after a while due to a memory leak. In order to quickly investigate where this memory leak comes from, let’s assume that we decided to analyze the memory dump of the application. Apart from this scenario, our applications may hang after a certain period of time, or they may generate deadlocks, exceptions and crash due to unknown problems. In order to address such various problems, we can easily get information by taking the current memory dumps of the applications. In order to perform a quick example, I prepared a simple code block that will perform memory allocation as follows.
using System;
using System.Collections.Generic;
using System.Threading;

namespace MemoryLeakNETFramework
{
	class Program
	{
		static void Main(string[] args)
		{
			Console.WriteLine("App started.");

			var productService = new ProductService();
			productService.GetProducts();

			while (true)
			{
				Thread.Sleep(TimeSpan.FromMinutes(1));
			}
		}
	}

	class ProductDTO
	{
		public int Id { get; set; }
		public byte[] XParameter { get; set; }
	}

	static class ProductUtil
	{
		public static byte[] CalculateSomething()
		{
			byte[] buffer = new byte[1024];
			return buffer;
		}
	}

	class ProductService
	{
		public List GetProducts()
		{
			List<ProductDTO> products = new List<ProductDTO>();

			for (int i = 0; i < 500000; i++)
			{
				var product = new ProductDTO()
				{
					Id = i,
					XParameter = ProductUtil.CalculateSomething()
				};

				products.Add(product);
			}

			return products;
		}
	}
}
As we can see, I made an allocation operation during the mapping process of product list to the “ProductDTO” class. In the real world, it is possible to encounter memory leak problems for various reasons such as the following.
- Unmanaged resources that are not disposed
- In-memory caching
- Incorrect thread usages
- Closure allocations
- Incorrect static usages
Let’s Start Getting Dump with Windows Container
First, let’s take a look at how we can get the memory dump of our application running on a windows-based container. In order to containerize the x86 .NET Framework 4.8 application, I used the “Dockerfile” below.
FROM mcr.microsoft.com/dotnet/framework/runtime:4.8-windowsservercore-ltsc2019
WORKDIR /app
COPY . .
ENTRYPOINT ["C:\\app\\MemoryLeakNETFramework.exe"]
Now let’s run the following commands first to take a look at the application we have deployed.
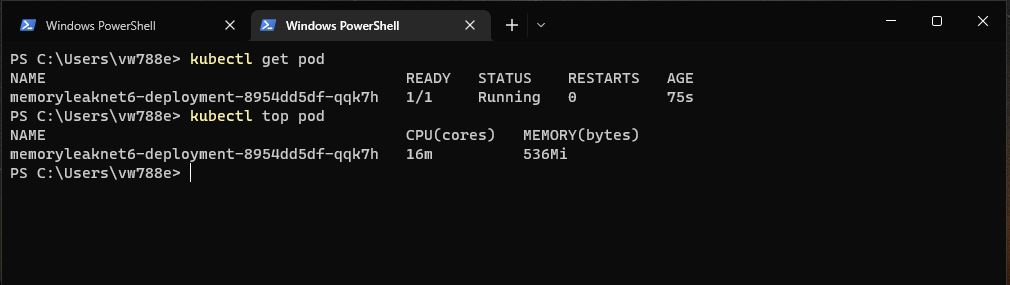
kubectl get pod
kubectl top pod
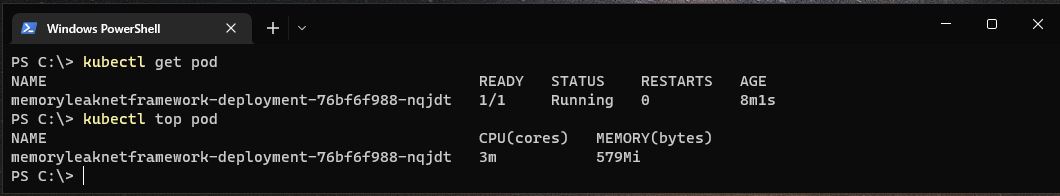 As we can see, the application is using around 579Mi of memory. We assume that usage increases over time and causes the application to crash. Now let’s go inside the pod and perform the memory dump operation before the application gets crashed. First of all, let’s run the following command to get into powershell session of the windows container.
kubectl exec -it YOUR_POD_NAME -- powershell
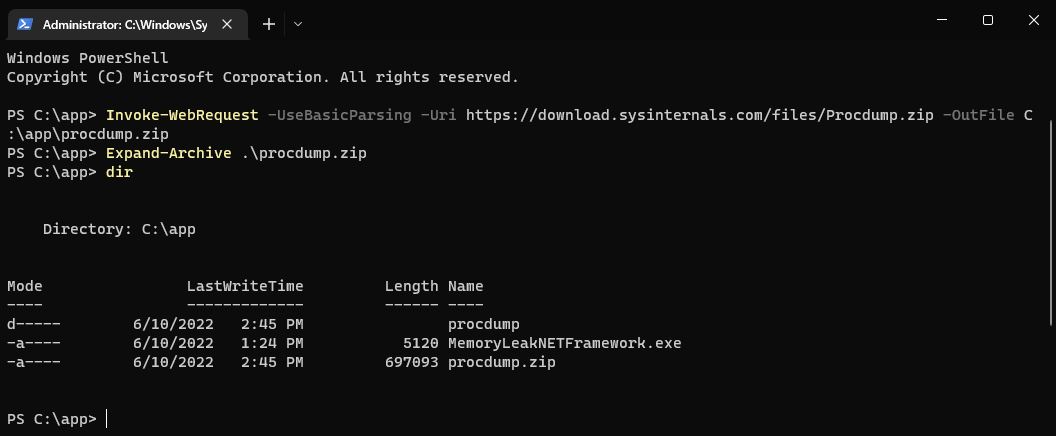
In order to perform the memory dump operation, we will use the ProcDump tool. ProcDump is a command-line tool that allows us to easily get memory dumps. After getting into the powershell session of the pod, let’s download the ProcDump tool with the help of the following command, and then extract it.
PS C:\app> Invoke-WebRequest -UseBasicParsing -Uri https://download.sysinternals.com/files/Procdump.zip -OutFile C:\app\procdump.zip

PS C:\app> Expand-Archive .\procdump.zip
 Now we need the process ID of the application. For this, let’s run the “Get-Process” command and copy the ID information of the relevant process. Then, let’s go to the “procdump” folder and run the command below to get the dump.
.\procdump.exe -ma YOUR_PROCESS_ID -s 5 -n 1 -accepteula
The important point here is to specify which target platform the application is running on “x86” or “x64”. If the application is targeting to “x64“, it will be sufficient to add the “-64” parameter when getting the dump. The default is “x86“. 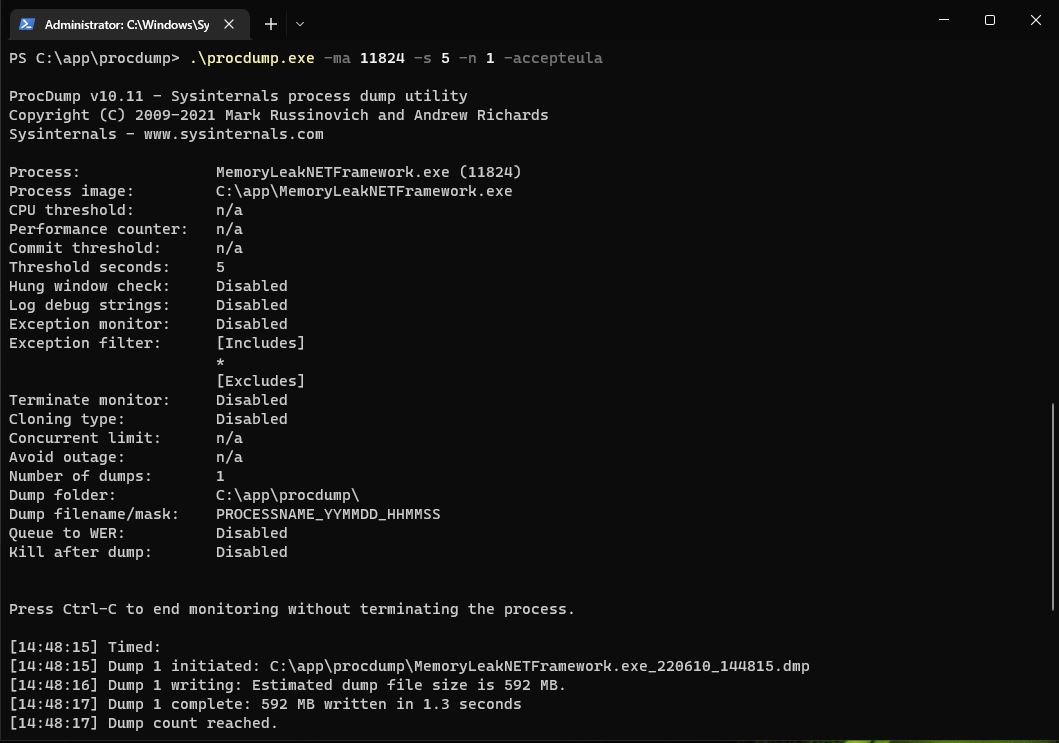 In short, we got a full process dump of the application for a period of “5” seconds. Since we got the full process dump, the size of the dump file is also quite large. But in many cases, getting a full dump can be life-saving. Now let’s compress the relevant dump file with the help of the following command. Thus, we can quickly copy the relevant dump file from the pod to our local environment.
PS C:\app\procdump> Compress-Archive .\MemoryLeakNETFramework.exe_220610_144815.dmp .\mydump.zip
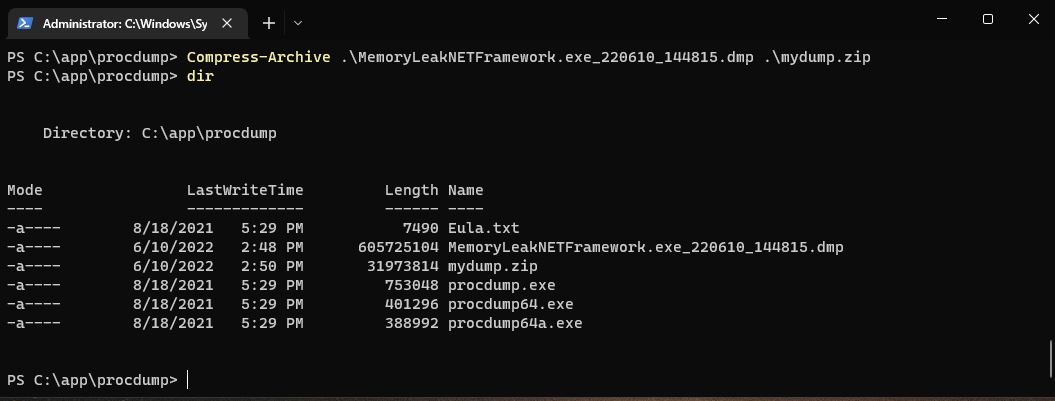 After compression, we can copy the “mydump.zip” file to our local environment. For this, let’s go to the “C:\” directory on our local environment, then perform the copying operation with the following command.
kubectl cp YOUR_POD_NAME:/app/procdump/mydump.zip ./procdump/mydump.zip
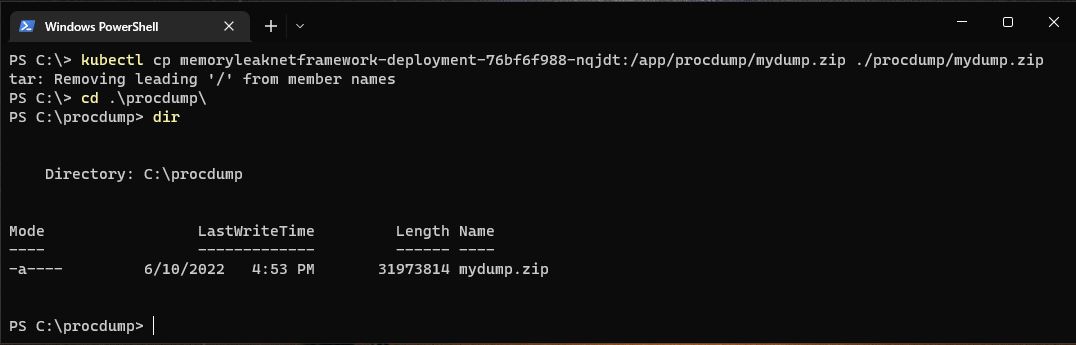 As we can see, the relevant dump file has been copied into “C:\procdump” directory.
Getting Dump with Linux Container
In order to perform an example with a linux container, I containerized the same code block with .NET 6 and deployed it on a linux-based nodepool. I used the following “Dockerfile“.
FROM mcr.microsoft.com/dotnet/runtime:6.0-focal AS base
WORKDIR /app

FROM mcr.microsoft.com/dotnet/sdk:6.0-focal AS build
WORKDIR /src
COPY ["MemoryLeakNET6.csproj", "./"]
RUN dotnet restore "MemoryLeakNET6.csproj"
COPY . .
WORKDIR "/src/."
RUN dotnet build "MemoryLeakNET6.csproj" -c Release -o /app/build

FROM build AS publish
RUN dotnet publish "MemoryLeakNET6.csproj" -c Release -o /app/publish /p:UseAppHost=false

FROM base AS final
WORKDIR /app
COPY --from=publish /app/publish .
ENTRYPOINT ["dotnet", "MemoryLeakNET6.dll"]
 Now, let’s get into the shell session of the container to get a dump.
kubectl exec -it YOUR_POD_NAME -- /bin/shWe have a few different options to perform dump operation in a linux container. This time I will use the .NET diagnostics CLI tools provided by Microsoft for .NET Core 3.1 and above. Within these tools there are two different tools that we can use called “dotnet-dump” and “dotnet-gcdump“. I will use the “dotnet-dump” tool because I want to be able to get benefit from SOS commands while performing dump analysis. First of all, let’s download the “dotnet-dump” tool into the container using the commands below. You can also check the different platform options here.
apt-get update
apt-get install wget
wget -O dotnet-dump https://aka.ms/dotnet-dump/linux-x64
chmod 777 ./dotnet-dump
Now let’s get the process ID of the application by running the “./dotnet-dump ps” command. After getting the process ID information, let’s get the dump of the application with the following command.
./dotnet-dump collect -p YOUR_PROCESS_ID
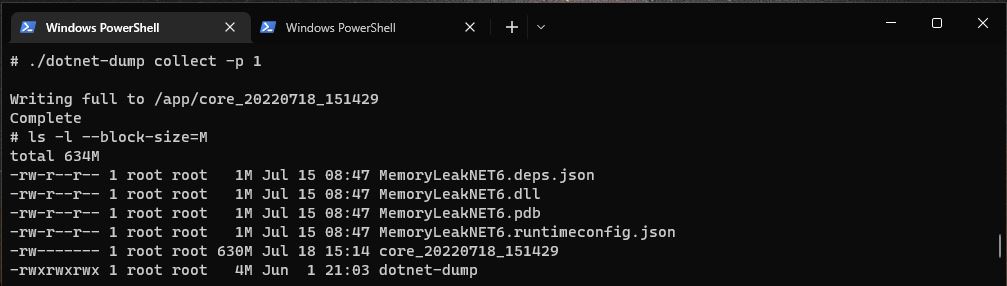 As we can see, the dump has been created with a size of “630MB“. Before copying it to our local environment, we need to compress the dump file in the same way. This time we can use the “gzip” tool inside the container.
gzip DUMP_NAME
After that we can copy the compressed dump file to our local environment as follows.
kubectl cp YOUR_POD_NAME:/app/DUMP_NAME.gz ./dotnetdump/mydump.gz
Let’s Analyze With WinDbg
To be able to analyze dump files, there are different tool options such as WinDbg, Visual Studio, PerfView etc. Within the scope of this article, I will use WinDbg for the dump we got from windows container. If you want to prefer more visual tool, you can also consider other options. If you don’t have WinDbg tool, you can get it by following the “Debugging Tools for Windows” topic on this link. There is also a new version called WinDbg Preview. But I couldn’t run it as stable as the old version. That’s why I’m going with non-preview version. Since we have performed the dump operation with the x86 target platform for the windows container, let’s run the WinDbg (x86) version and follow the “File>Open Crash Dump” menu and select the dump file that we copied under the “C:\procdump” directory. 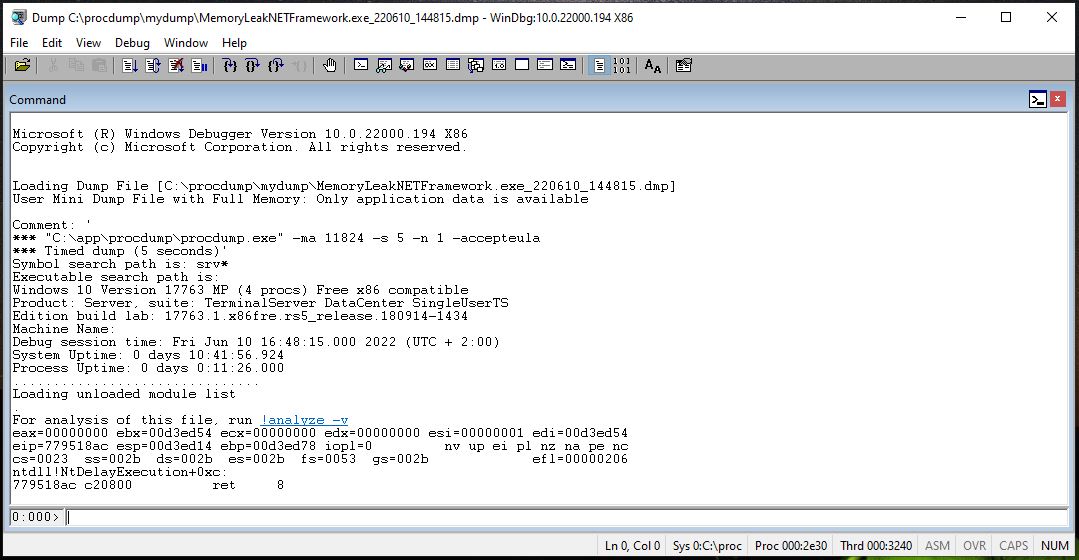 First of all, in order to use symbols in debugging operations (for callstack, variables), let’s add the paths of the “Microsoft Symbol” server and the pdb files of the application to the symbol search path as follows.
.sympath srv*https://msdl.microsoft.com/download/symbols
.sympath+ C:\source\MemoryLeakNETFramework\bin\Debug
Then, let’s run the following commands to see detailed symbol logs and load new symbol information.
!sym noisy
.reload
Now in order to debug the managed code, we need to install the SOS Debugging Extension into WinDbg. During this installation process, we should be careful that the version of the SOS extension we want to install and its bitness, should match with the CLR version and the bitness of the host machine that we got the dump. Fortunately, the appropriate SOS extension can be easily installed with the “!analyze –v” command. Normally we can use this command for exception analysis for crash dumps but we can also use this command to automatically load all required dlls via symbol search paths.
NOTE: Things might get a little complicated if the appropriate SOS dll cannot be found. If the target server where the dump was taken from can still be accessible, the relevant SOS and mscordacwks dlls should be taken from there or the relevant Microsoft update patch should be found and the related dlls should be taken from there. Then should be manually included in WinDbg with the command “C:\SOS\sos.XXX.dll“.
Now, let’s run the “!analyze –v” command and let relevant SOS extension gets loaded. 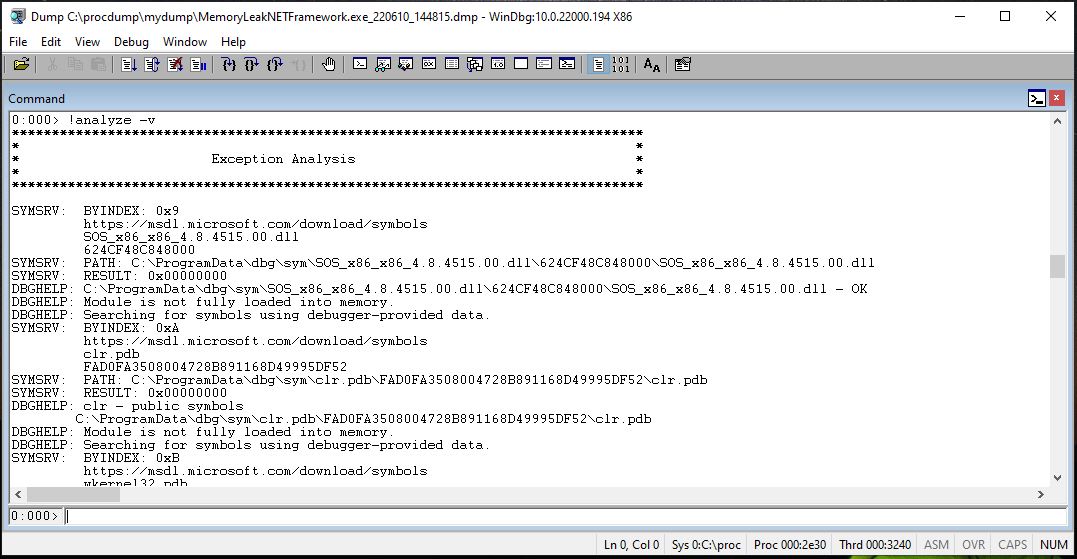 As we can see, the SOS extension is loaded into WinDbg with the version “x86_4.8.4515.00“. In addition, to see the other loaded extensions, we can run the “.chain” command. Now we can start analyzing the heap. First, let’s run the following command.
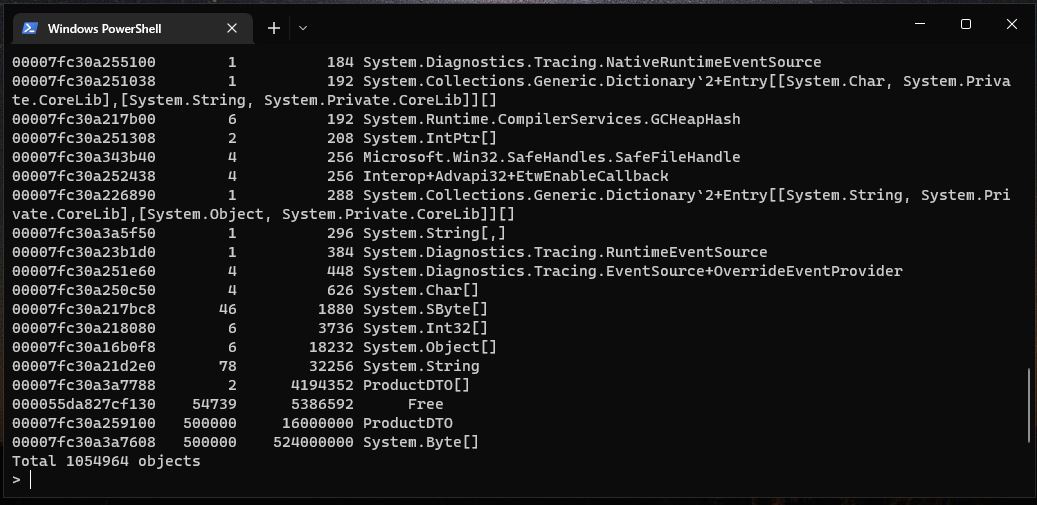
!dumpheap -stat
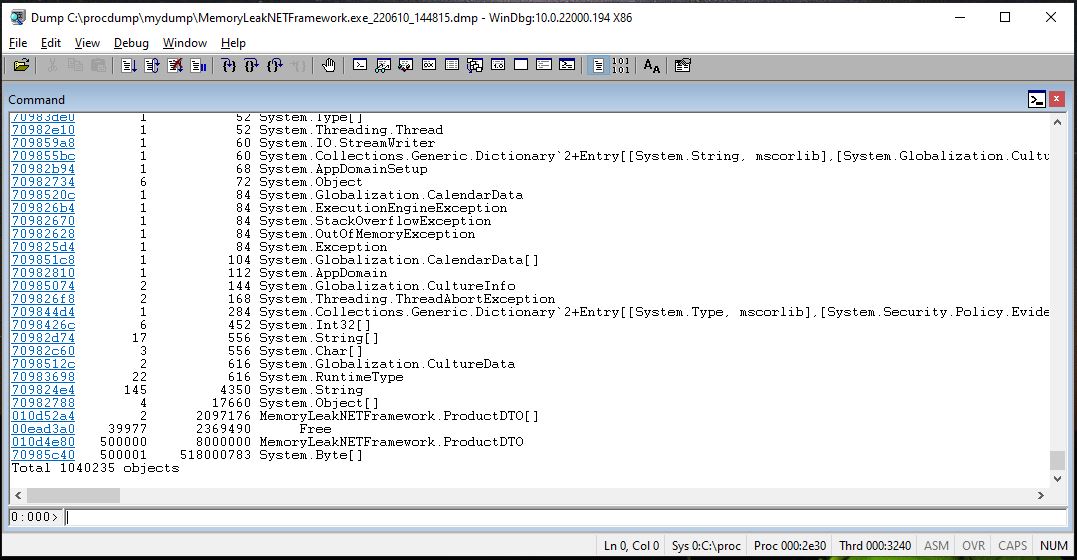 This command briefly shows us a statistical summary of the objects allocated in the managed heap and how much memory they use. In our scenario, our aim is to determine the point that caused the memory leak. So analyzing the heap, understanding what was happening at that time, will take us to the right point. If we take a look at the picture above, we can see that the “MemoryLeakNETFramework.ProductDTO” and “System.Byte[]” objects are registered “500000” times and allocates an average of “8MB” and “518MB“. Based on this information, we can say that the memory leak may be caused by these points. In short, while looking the memory leak source, we should be analyzing the objects according to whether they are being registered too much or the size they allocate. Now let’s take a look at the details of the “MemoryLeakNETFramework.ProductDTO” object. For this, we first need to access the method table of this object. So let’s copy the MT (Method Table) address in the first column of the “MemoryLeakNETFramework.ProductDTO” object and run the following command.
!dumpheap -mt 010d4e80
Then, by getting the memory address of any instance from the listed results, let’s access its details as follows.
!dumpobj 386fde58
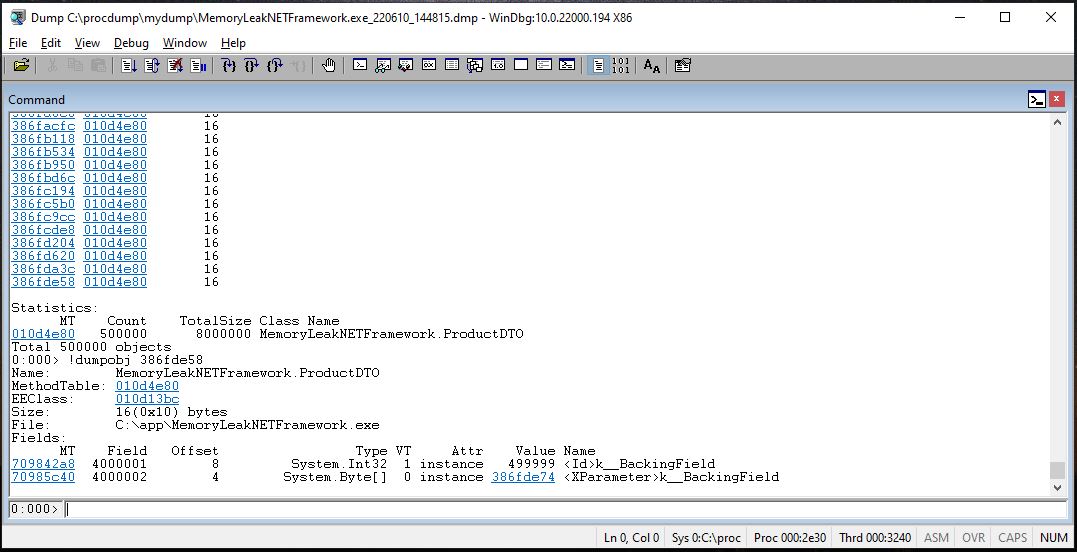 As we can see, by dumping the objects in the memory, we can access the values of the object at that time. If we want, we can also see the size of an object we want with the “!objsize” command. For example, in order to see the size of the “System.Byte[]” field in this object, let’s copy the reference address in the “Value” column and run the following command.
!objsize 386fde74
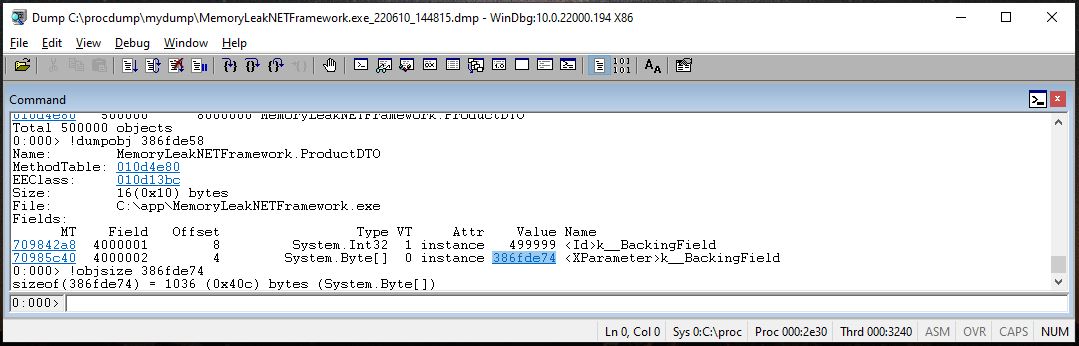 As we can see, the “System.Byte[]” field in the “MemoryLeakNETFramework.ProductDTO” object allocates “1036” bytes in the memory. By considering that “500000” times also registered in the heap, we can say that an average “518MB” allocation is happened due to these fields.
Let’s Analyze Core Dump with Dotnet-Dump
Now let’s take a look at the analysis process of the core dump we got with the “dotnet-dump” tool in linux container. The “dotnet-dump” tool not only allows us to get dump from linux or windows, but also allows us to analyze the dump. It even allows us to perform ad-hoc analyzes in the relevant container without moving the dump file to our local environment. Now, before performing the analysis in our local environment, let’s install the “dotnet-dump” tool in our local environment as follows.
dotnet tool install --global dotnet-dump
Then, by running the command below, we will access the interactive analysis terminal session of “dotnet-dump“.
dotnet-dump analyze .\YOUR_CORE_DUMP_PATH
Now, we can perform the analysis we want by using the same SOS commands (most of them) as we have done with WinDbg. For example, to analyze the heap again, let’s use the same following command.
dumpheap -stat
 As we can see, we can analyze the memory leak source in the same way by performing the same operations with the SOS commands. Some useful commands that I like to use:
- By using the “threads” command, we can list all the threads and switch between them. We can use “~[threadid]s” command for WinDbg and “threads [threadid]” command for “dotnet-dump“.
- With “clrstack” command, we can view the stack of the related thread and analyze what is going on in the memory. For example, looking for exceptions.
- With “gcroot” command, we can list all other objects that hold the reference of relevant object.
- We can also look at the sync block table with the “syncblk” command. Especially if we want to analyze deadlocks, we can find out which thread holds the lock via the sync block table and then analyze the clrstack of the relevant thread.
Be First to Comment